A Markdown File Became Our Company-Wide On-Call Cheat Code

How a staff engineer turned scattered tribal knowledge into a git repo with Claude Code that lets any team member run a six-system support investigation in two minutes.
A support ticket comes in, and you open Plain, then Sentry, then Datadog, then a SQL client, then Linear, then the backend source code. Six tabs across six different systems, thirty minutes of bouncing between them before you even form a hypothesis. And if you’re new, you don’t even know which tabs to open first.
I joined Mergify as a staff engineer in May 2025, and when I finally joined the on-call rotation, it was the hardest thing I’d done at the company. Debugging a stuck PR means understanding speculative merges, batch bisections, priorities, GitHub undocumented behavior, queue freezes. My colleagues had all of this in their heads. I had a notebook and a growing suspicion that I was in over my head.
I started writing things down. I shadowed colleagues during investigations, took notes on which queries they ran and which Datadog search patterns actually worked, which database tables held the answers and which were red herrings. Over the next few months, I got comfortable with the process. I had a solid runbook and could run an investigation without panicking. But it was still slow.
When we adopted Claude Code in early 2026, the first thing I thought was: if this thing can automate tasks, I want it to automate this one.
The Repo Is the Tool
It’s a GitHub repository. No backend to deploy, no infrastructure to maintain. It contains:
- Company codebases as git submodules (our back and front ends, infrastructure as code)
- A
.mcp.jsonfile declaring six external systems (Sentry, Datadog, Linear, Plain, Notion, incident.io) - A
CLAUDE.mdfile that contains our complete support runbook - A toolkit based on Claude Code slash commands: common investigation queries and log search patterns
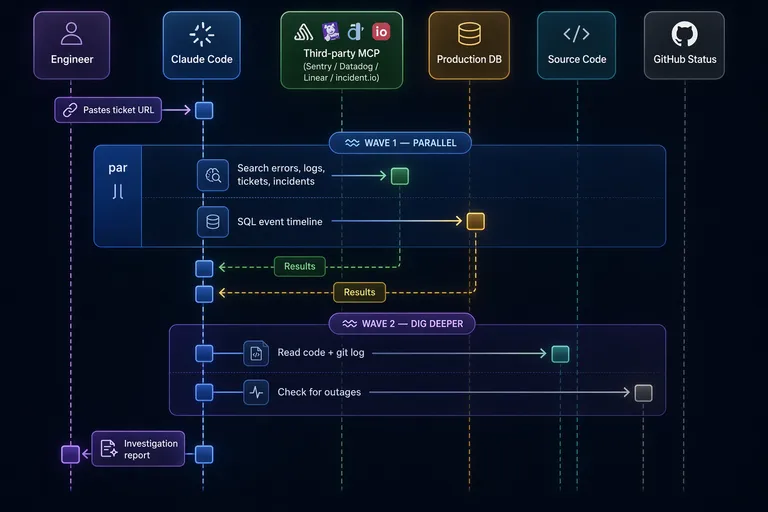
An engineer opens Claude Code in this repo, pastes a support ticket URL, a Linear bug ticket, a Sentry issue ID, or any issue they’re facing, and Claude starts investigating. It fetches the context via MCP, extracts the customer, repo, and PR number, then fires off parallel queries across all six systems.
Why git specifically, and not a Notion doc or a Slack bot? Because git gives you version control on the runbook with blame history to trace who changed what. And you get submodules that let Claude read our actual source code and its history during an investigation.
Logs, metrics, and database records tell you what happened. Understanding why it happened means reading the backend code that produced those events. And sometimes the answer isn’t in the current code at all. It’s in a recent commit that changed behavior. Claude can run git log on a submodule, spot a suspicious change that landed days before the customer’s issue started, read the diff, and connect the dots. Having the codebase with its full history in the same repo means Claude can go from a Datadog trace or a database record to the relevant code path or commit in seconds. The repo is the working surface, not just a container for config files.
The Runbook Lives in CLAUDE.md
The hardest part wasn’t the MCP integrations or the SQL queries. It was writing the runbook.
The knowledge I needed was scattered across the team. One colleague knew exactly which log patterns and attributes to search for in Datadog, and could reconstruct an incident from logs alone. Another had such a deep understanding of the codebase that they could connect a customer symptom to the responsible code path almost instantly. Everyone knew to check GitHub’s status page when things stall for no obvious reason. All useful knowledge, none of it written down.
I had to collect all of that and write it in a way that Claude could follow. Each slash command encodes a specific investigation path: one runs eight SQL queries to reconstruct a PR’s full lifecycle, another documents over a dozen Datadog log patterns with their meanings. Vague instructions produce vague results, so the runbook reads more like a checklist than a guide.
The runbook belongs to the team now. When a colleague finds a new failure pattern or a better Sentry query, they open a PR and update the file. It gets more specific with every investigation, and everyone picks up the changes on their next claude session. It’s a text file in git. That’s it. But a text file that the team actively maintains turns out to be worth more than a wiki page that nobody reads.
Today, everyone on the team can run an investigation and get useful output within minutes, from front-end engineers to people who joined last month. They still need judgment to validate Claude’s conclusions (more on that in the failure mode section), but they don’t need the entire system in their head to get started.
Parallel Waves
When you manually triage a ticket, you do things one at a time because you only have one brain. Claude can launch background agents, so we structured the runbook around two investigation waves.
Wave 1 fires everything at once: a SQL query reconstructing the PR’s full event timeline from production, a Sentry search (actually four Sentry searches with different strategies), Datadog log queries scoped to the merge queue worker, a Linear search for existing tickets, and an incident.io check for ongoing platform incidents. All in parallel, all running as background agents.
Wave 2 is where the actual thinking happens. Once Wave 1 results land, Claude starts connecting the pieces: a Sentry error points to a file, so it reads that code, then checks git log to see if a recent commit changed the behavior. Or maybe Wave 1 found nothing wrong on our side, so Claude checks GitHub’s status page for an outage that would explain the symptoms. The runbook encodes these paths explicitly, so Claude is following a playbook, not improvising.
Based on the last couple of months of tickets: the investigation phase that used to be 30 minutes of sequential tab-switching now takes about 2 minutes of waiting for queries, plus a few more minutes where I read and validate the output.
MCP Made the Plumbing Trivial
Early on, I built local MCP servers for Plain and Datadog: small TypeScript wrappers around their SDKs, with Zod schemas for input validation. They worked fine but meant more stuff to maintain. Over the next few weeks, both vendors shipped their own hosted MCP endpoints, so I deleted my local code and pointed .mcp.json at their URLs instead.
Today the entire MCP configuration is this:
{
  "mcpServers": {
    "sentry": { "type": "http", "url": "https://mcp.sentry.dev/mcp" },
    "linear": { "type": "http", "url": "https://mcp.linear.app/mcp" },
    "plain": { "type": "http", "url": "https://mcp.plain.com/mcp" },
    "datadog": {
      "type": "http",
      "url": "https://mcp.datadoghq.com/api/unstable/mcp-server/mcp"
    },
    "notion": { "type": "http", "url": "https://mcp.notion.com/mcp" },
    "incidentio": { "type": "http", "url": "https://mcp.incident.io/mcp" }
  }
}
Six HTTP endpoints, zero local servers. OAuth authentication happens through the browser on first use, and I wrote almost no glue code. The vendors did the work.
Production SQL: The Scary Part That Works
Claude can query our production PostgreSQL database directly. My CTO did not flinch (much). The controls are tight enough that we’re all comfortable with it.
The hard guarantees live at the infrastructure level. The database connection goes through Cloud SQL Proxy with short-lived gcloud tokens. The IAM role is strictly read-only (no writes possible, period). Connections are ephemeral with a 30-second proxy timeout. And only one specific shell script is whitelisted for execution via Claude Code’s permission system, configured as an actual allowlist in .claude/settings.json.
On top of that, prompt-level conventions tell Claude to use LIMIT clauses, avoid SELECT *, and add time filters. Claude can ignore those. If it does, the worst case is a slow read query that times out, not data corruption. The tables Claude queries don’t contain sensitive data, only merge queue operational records: event timelines, check run statuses, queue state. That data does pass through Anthropic’s API when Claude processes the query results, but there’s nothing in there we’d lose sleep over.
The production SQL is one input among several. But it’s the input that would take the longest to get manually.
Claude Has Confirmation Bias Too
One reason I built this tool was that human investigations are shaped by what you check first. You find one error in Sentry, and suddenly everything else you look at gets filtered through that first clue. It’s textbook confirmation bias. So I figured an automated system would be more objective.
It’s not.
Claude does the same thing. It picks up an early signal, a Sentry error from the right time window, a Datadog log spike that correlates, and builds the entire investigation around it. Every subsequent piece of evidence gets woven into a narrative that supports the initial assumption. The explanation reads well, it’s internally consistent, and sometimes it’s completely wrong. The error was unrelated, the log spike was a coincidence, and the customer report was about something else entirely.
I find this funny in a humbling way. We gave an AI our investigation process and it developed our worst cognitive habit.
Over more than 100 investigations in the past couple of months, roughly three out of four come back clean: the engineer reviewing the output didn’t need to change the root cause before acting on it. That’s not a rigorous metric. Nobody is formally grading each investigation. It’s the team’s working sense from daily use.
The ones that go wrong follow a pattern. Claude latches onto an assumption early and never lets go, seeking validation instead of testing the hypothesis. The real skill is recognizing when that’s happening. It’s the same skill a good engineer already has when debugging: am I looking for evidence, or am I looking for confirmation? The difference is that with Claude, you’re reviewing someone else’s reasoning instead of your own, which is easier to spot but harder to catch before it shapes your own thinking.
Engineers still read every investigation before acting. Creating Linear tickets or sending customer responses needs a human to sign off. Useful enough to keep, but not reliable enough to run unattended.
What Stayed
The first working version took about ten hours to wire up, on top of months of manual runbook-building that made it possible. The runbook has been evolving since, sharpened after every real investigation, with contributions from across the team. People adopted it within days because there was no learning curve. You paste a ticket URL and read what comes back.
I started this project because on-call was scary and I needed a crutch. The crutch turned out to be the whole team’s preferred way of investigating support tickets. A git repo with a long markdown file, some SQL queries, a handful of MCP endpoints, and a review process everyone already understood. You improve it the same way you improve any code: open a PR.