Lessons From a Noisy Monitor
Your database monitors keep firing even though nothing is wrong? We hit the same problem: noisy IOPS alerts caused by predictable jobs. This post explains how we replaced brittle thresholds with an SLO-based approach that restored signal, eliminated noise, and stopped the monitor from "crying wolf."
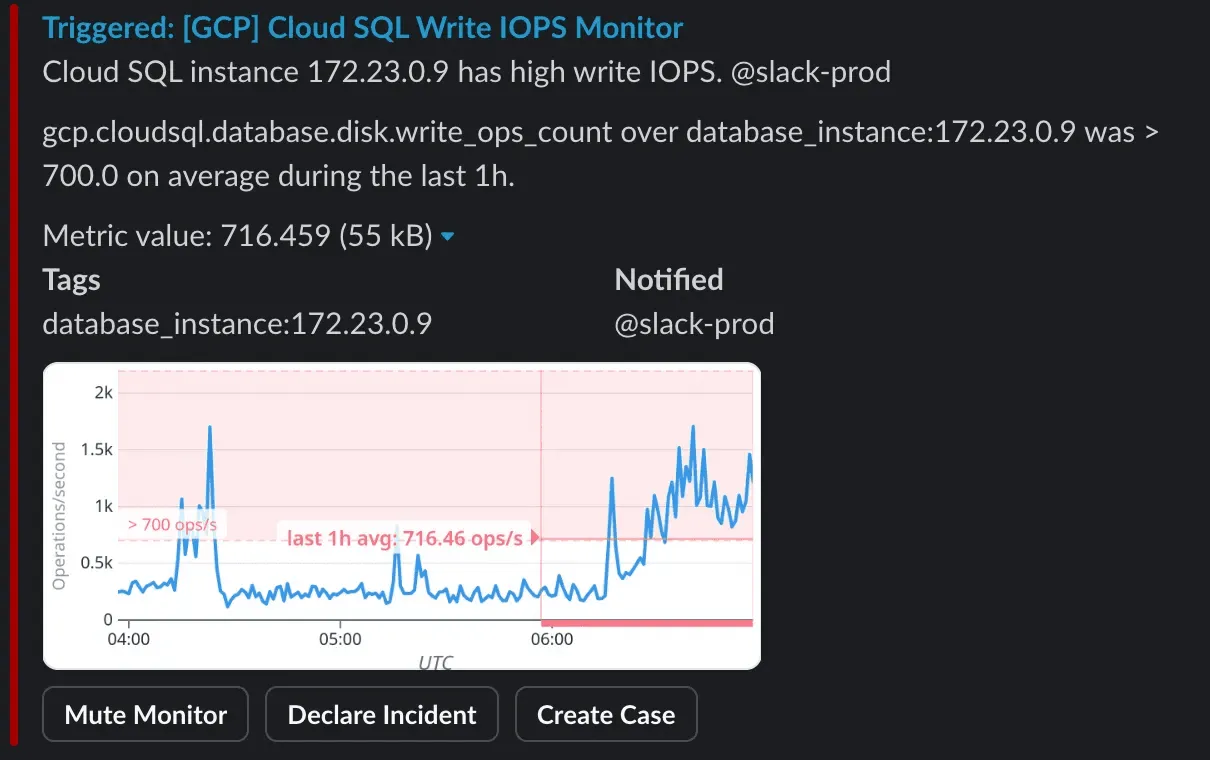
Every week, at least one morning follows the same pattern: our alerting channel lights up with a burst of “Database Disk IOPS” alerts. Not a slow trickle, but a cascade of red warnings insisting that our primary database is under critical write pressure.
Yet nothing is actually wrong. Queries’ latency remains stable, the database CPU utilisation is low, and application performance remains unaffected.
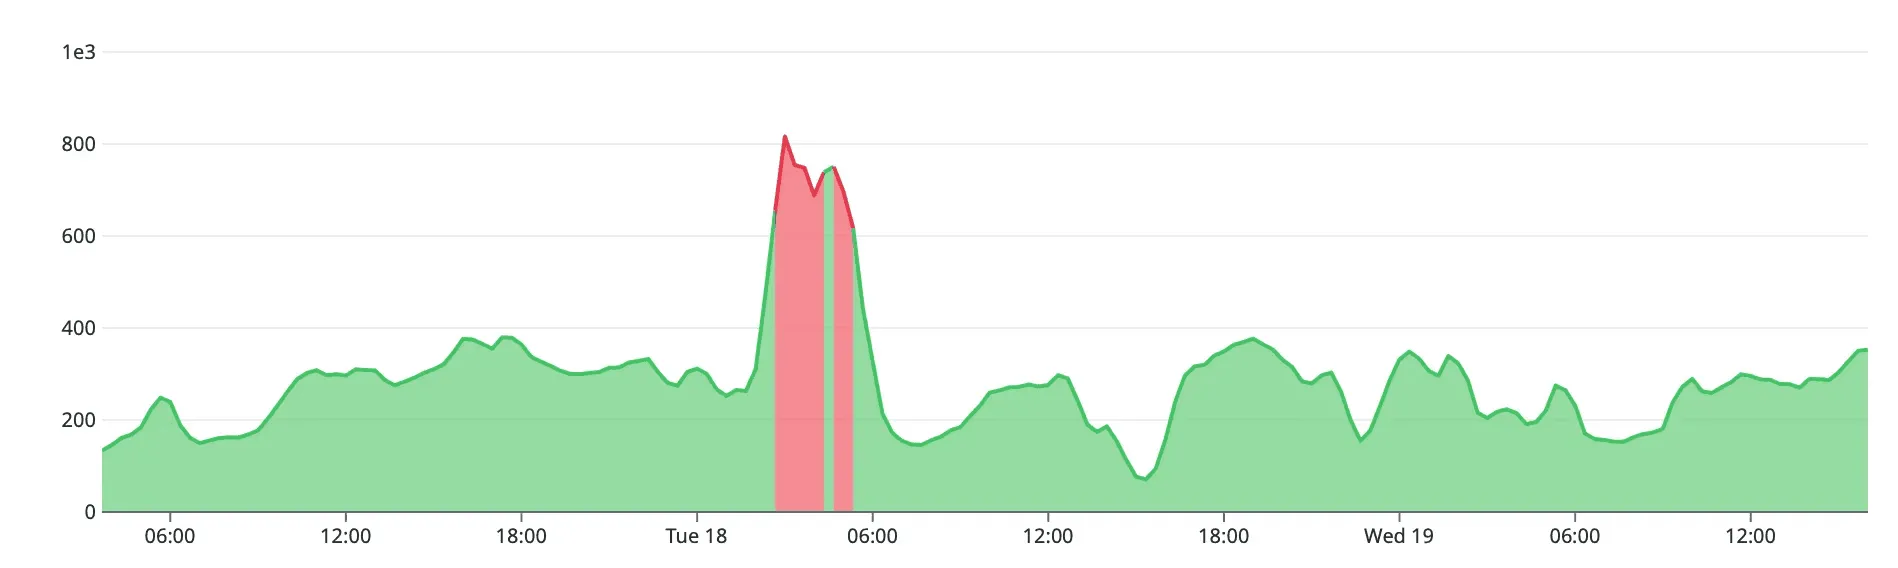
The culprit is always the same. Our early-morning purge job (a batch deletion of expired data across several models) runs once a day. Depending on how much data aged out since the previous run, it may delete anywhere from a few thousand rows to several hundred thousand. When that happens, write operations surge. The pattern is consistent: four distinct bursts of I/O spread across a process that can last from a few minutes to nearly three hours.
Over time, the entire team internalised the trend. “It’s just the purge job again.” And at that moment, the alerts ceased to be alerts.
Nobody investigated anymore, not out of negligence, but because the monitor repeatedly signalled a condition that had no operational impact. A monitor that fires without producing meaningful action does not improve observability. It erodes it.
This is what alert fatigue looks like in practice. Not inbox overload, but a quiet shift in behaviour where a recurring signal becomes background noise, and where a real incident could hide behind a familiar pattern.
Something had to change.
Threshold Tuning: The Usual Instinct
Our first reaction was the same one most engineering teams have when a monitor fires too often:
“Maybe the threshold is just too low.”
It is an easy conclusion to reach. If a monitor is noisy, it may simply need calibration. But as we examined the situation more carefully, it became clear that the thresholds were not the issue.
The monitor originally served a legitimate purpose. It was created to detect abnormal write pressure on the database: an early indicator that our storage layer might be saturating, or that an unexpected increase in write volume was propagating through our application. It was never meant to diagnose incidents, only to surface the earliest signs of degradation.
This is precisely where fixed thresholds break down. Any adjustment that suppressed alerts during the purge would also suppress alerts during the situations the monitor was designed to catch.
The problem wasn’t the spikes. The problem was semantic.
We were asking a threshold-based monitor to interpret a workload pattern it could not understand. Thresholds are excellent at detecting unexpected anomalies. They are terrible at evaluating expected, cyclical workloads.
We did not need a different number; we needed a different question.
The SLO Way
Once we finished bending the threshold in every possible direction, an uncomfortable idea surfaced:
What if we removed the alert?
After all, we already monitor what truly matters for customers: endpoint latencies. If the purge job ever pushed the database hard enough to hurt user-perceived performance, our latency monitors would catch it.
But deleting the alert felt wrong. The IOPS signal was not meaningless. It was simply being interpreted through the wrong lens.
It still provided three forms of value:
- Early indicators of disk saturation.
The database can show signs of write pressure long before latency becomes visible. Losing that signal would shorten our diagnostic runway.
- Coverage for endpoints without perfect latency monitoring.
Not every code path has robust performance alerts. IOPS anomalies often surfaced regressions in areas where observability was still incomplete.
- Context for debugging latency regressions.
High write pressure is rarely the incident itself, but it is frequently the precursor. Without this metric, root cause analysis becomes slower.
The metric was useful. What we needed was a way for it to stop shouting during normal behaviour.
The breakthrough came when we reframed the problem:
The alert should not fire when the number is high. It should fire when the system breaks its promise.
This was not a threshold issue. It was an SLO issue.
We didn’t need a static line that the purge job would cross every week. We needed a way to determine whether the database was still upholding the level of reliability our users expect, even under heavy, predictable workloads.
Turning the old threshold alert into a database SLO gave us exactly that:
- early detection of real degradation,
- tolerance for predictable purge-induced spikes,
- and a signal we could trust again.
Designing the SLO
Once we committed to an SLO-based approach, we still needed concrete numbers. And rather than invent new metrics, we chose to keep the exact signal that had caused all the noise, but reinterpret it through the lens of reliability instead of absolute thresholds.
The SLI: Write Operations per Second
Before defining an objective, it helps to restate what an SLI represents: a measurable indicator of how the system actually behaves.
An SLI is descriptive, not prescriptive. It does not express a goal; it expresses reality.
For our case, the most meaningful lens remained the same metric used by the original alert:
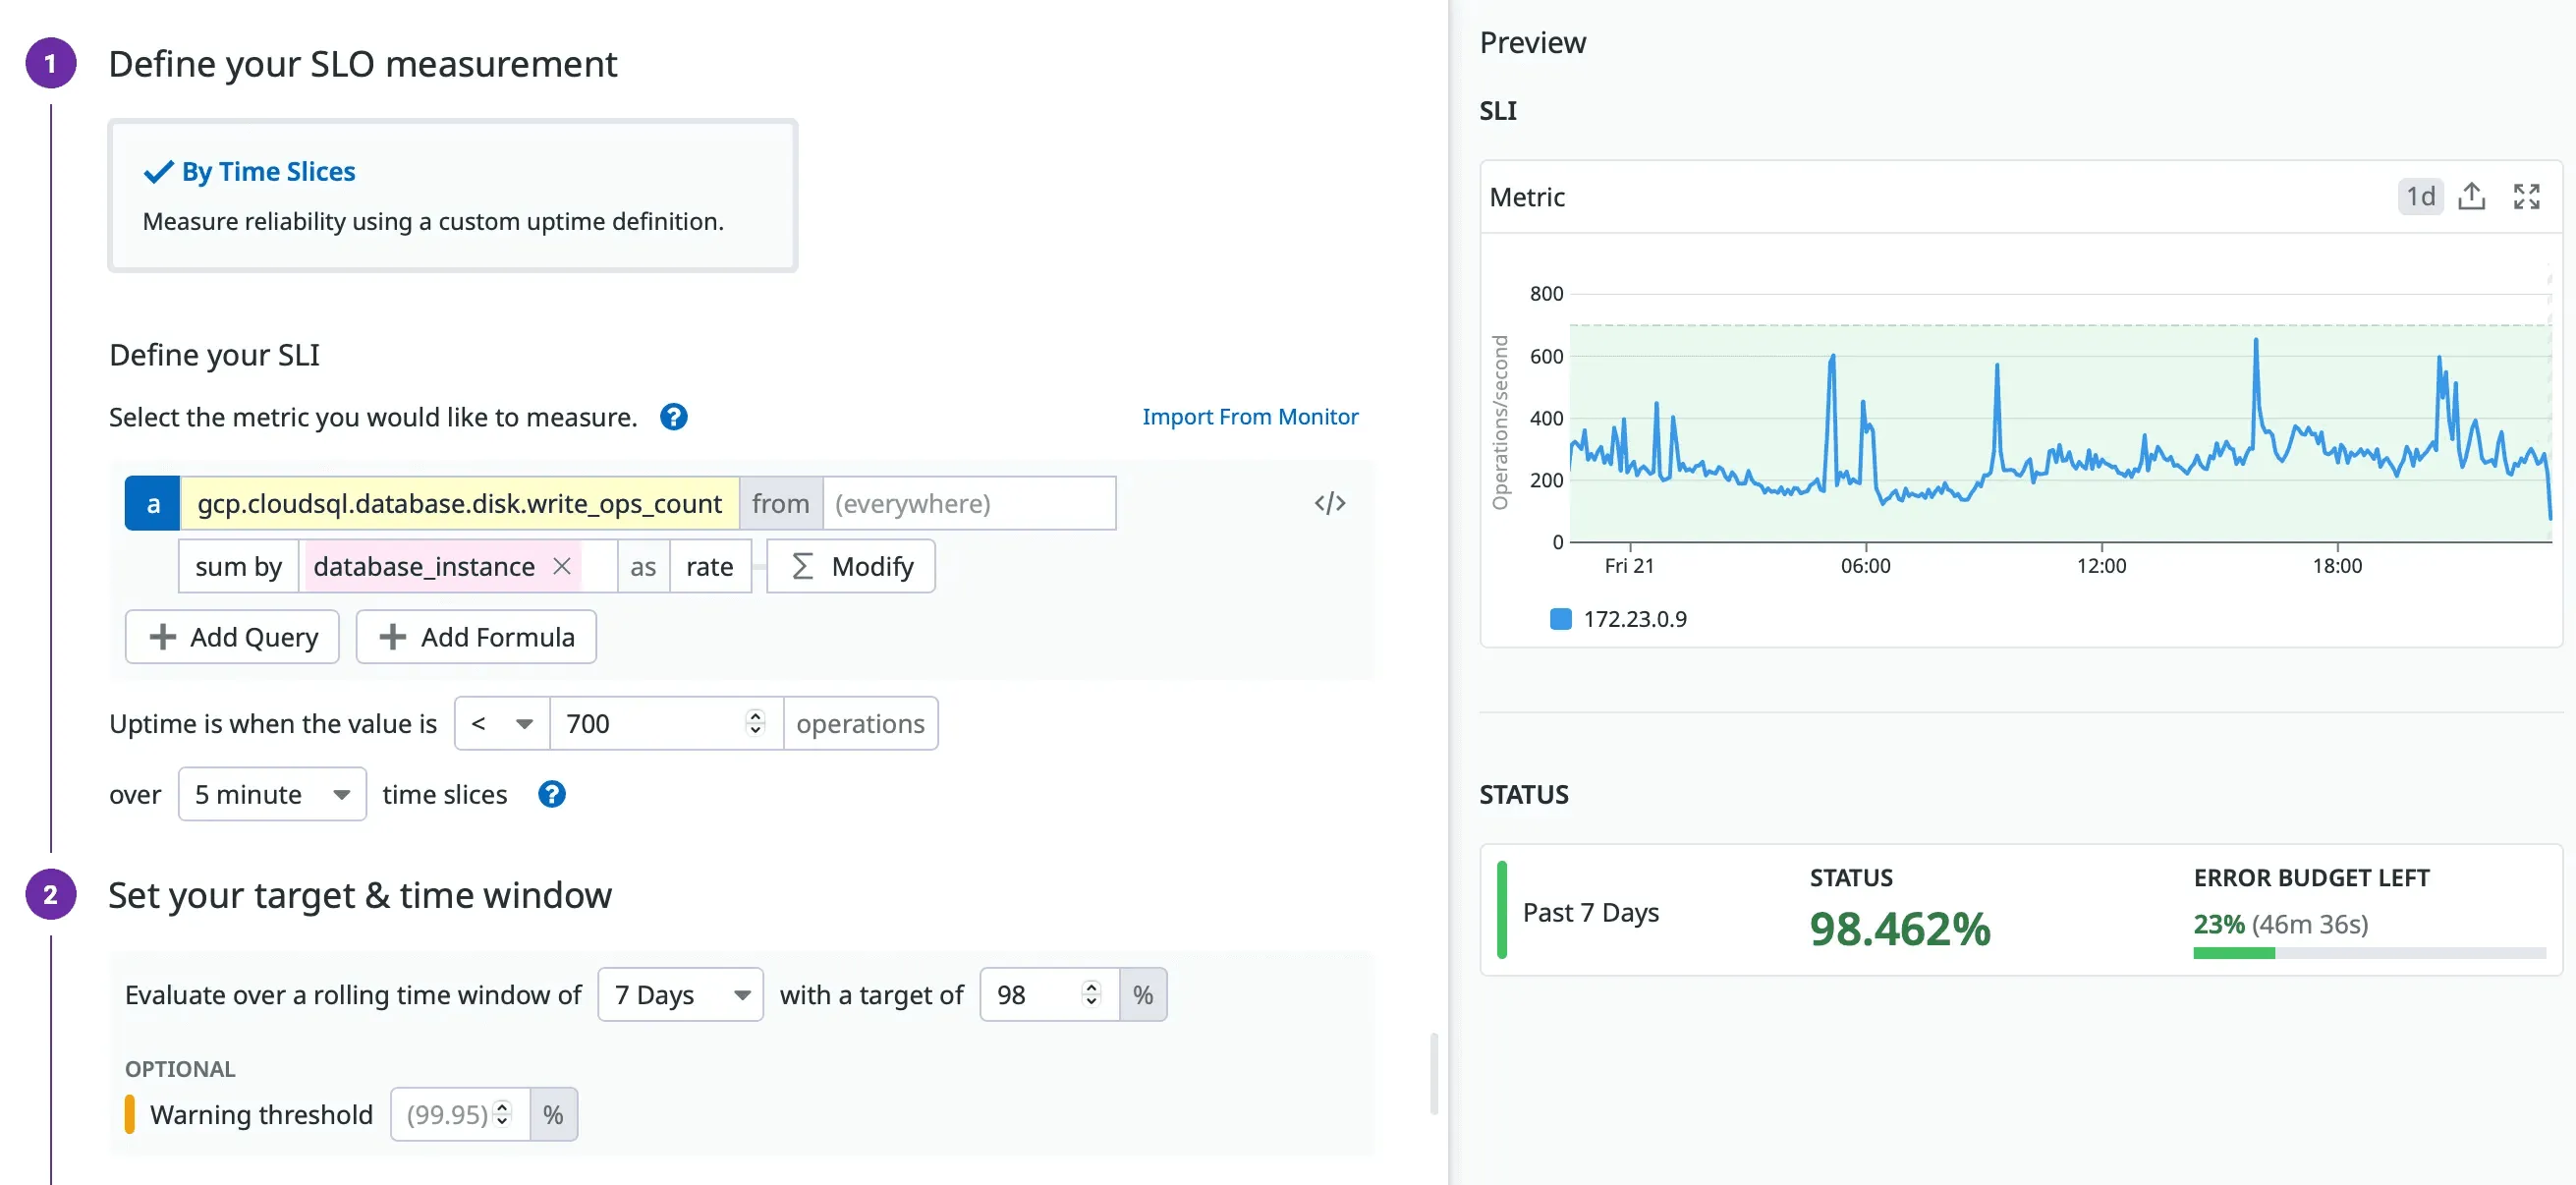
sum:gcp.cloudsql.database.disk.write_ops_count{*}
  by {database_instance}.as_rate() > 700
Historically, our database has operated at roughly half of 700 write ops per second. We also know that sustained rates above 700 only occur during the purge job, and that the disks remain completely healthy at that level.
This made 700 a reasonable good versus bad boundary for the SLI:
- It is well above the everyday load,
- It reliably marks periods of write-heavy activity,
- and it gives us a stable reference point for evaluating reliability over time.
In an SLO, this number is not a threshold for triggering an alert. It is the dividing line used to measure whether the system behaved within expectations.
The SLO: 98%
If the SLI tells us what happened, the SLO defines our promise:
How often should the database remain within the acceptable range of write pressure?
We set the initial objective at 98 percent, which corresponds to an error budget of:
- 3 hours 21 minutes 36 seconds of allowed “bad time” per week
*(via *uptime.is/98)
This value was chosen for a practical reason backed by data. Over a typical week, the database spends roughly three hours above the 700 write-ops boundary: almost entirely during our most extensive purge runs. These events are predictable, well-understood, and have no impact on customer-facing latency.
A 98 percent target, therefore, gives us:
- an SLO that stays green under normal behaviour,
- enough room for the purge workload we explicitly accept,
- and a clear signal when something pushes the system beyond that expected weekly envelope.
Is 98 percent the forever answer? Not necessarily. As observability improves and purge characteristics evolve, we will revisit it. What matters is that the target reflects the system’s current behaviour, not an aspirational ideal.
Designing the Alerting
Introducing an SLO provides a clear red/green indicator of system reliability, but it is not an alert. An SLO indicates whether the system is consuming its error budget; it does not inherently indicate whether a human needs to intervene.
That is where SLO-based alerting comes into play.
In practice, we rely on two distinct mechanisms:
- Burn-rate alerting: fast detection of unusually rapid budget consumption.
- Error-budget exhaustion alerting: detection that we have consumed, or are close to consuming, the allowed weekly budget.
Before discussing how we built them, it’s essential to highlight another underlying issue in the old monitoring setup.
The Other Core Problem With the Old Monitor
The original threshold-based alert had a deeper problem: it wasn’t tied to any actionable response.
A useful alert must clearly answer three things:
- what is happening,
- why it matters,
- what the responder is expected to do.
Our previous IOPS alert answered none of them. It simply shouted “IOPS high!” at predictable moments, with no operational consequence, no guidance, and no follow-up steps.
This made it a classic example of a non-actionable alert, the kind that should never reach humans. If an alert fires and there is no reasonably defined human action attached to it, that is a strong signal that it belongs on a dashboard, not on a pager.
The SLO approach addresses this by giving meaning to the metric: alerts now trigger only when reliability is actually at risk, not when a known batch job is behaving exactly as expected.
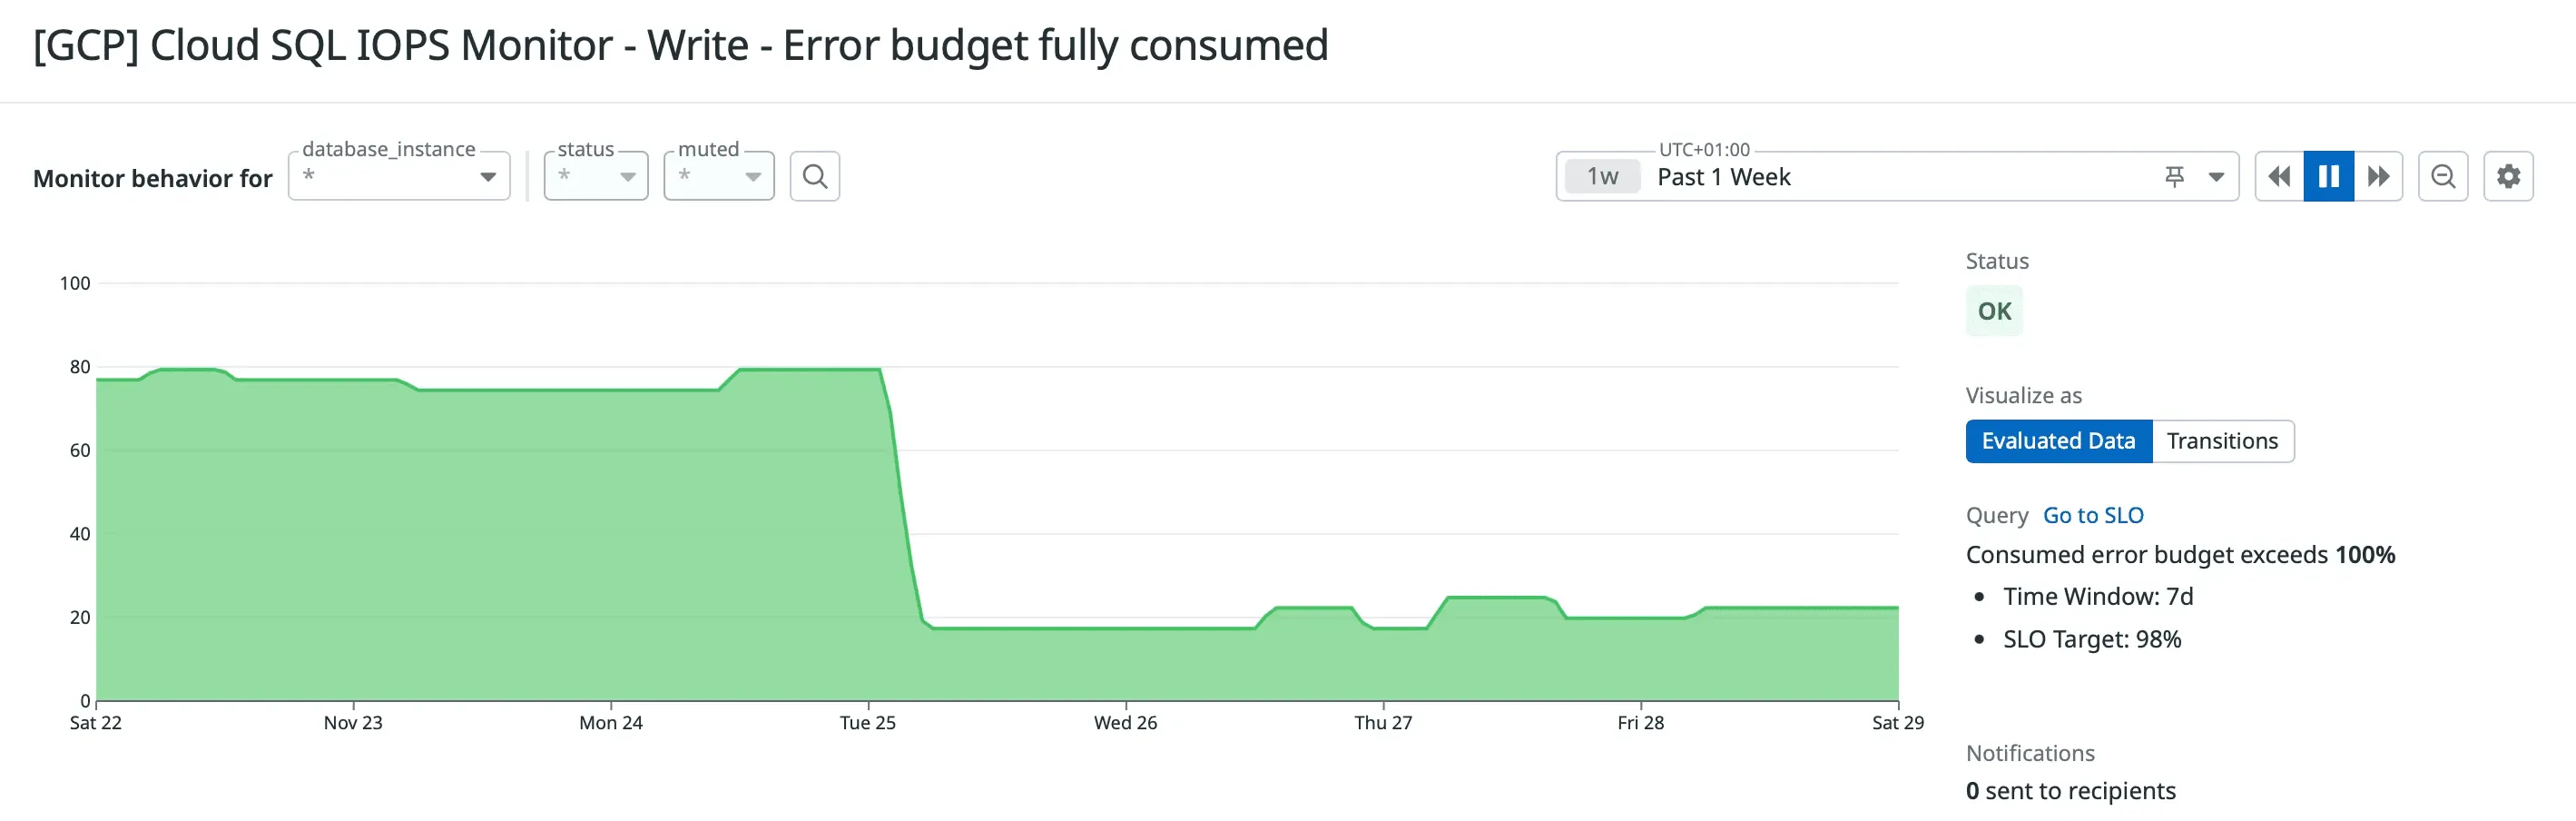
Error-Budget Alert: The One That Actually Matters
Once the SLO was defined, the alerting strategy became much simpler: alert only when the budget is fully consumed.
Because our largest purge jobs can last up to three hours, and our weekly error budget is three hours twenty-one minutes, setting the alert at 100 percent budget consumption is the most accurate reflection of our intent:
- If the purge stays within its expected window, the alert stays green.
- If anything else consumes additional budget beyond the purge, we are immediately notified.
- If the purge unexpectedly extends beyond its historical duration, we catch that deviation immediately.
This aligns alerting with the behaviour we actually care about: unexpected reliability degradation, not expected, periodic heavy load.
Here is the exact error message we use for this SLO alert: concise, actionable, and tied to a clear operator response:
# Description

Database write-pressure SLO violated: weekly error budget fully consumed.
This indicates unexpected write pressure — an early sign of database saturation.

# Action

- Go to Datadog [database page](<https://app.datadoghq.com/databases/list>) and select the affected database instance.
- In the **Metrics** tab, locate **Disk Read/Write OPS** and identify the period(s) with abnormal Write OPS.
- In the **Queries** tab, filter to the identified time period(s) and sort by execution count or rows affected to find queries causing the load.

# Note

If endpoint latency increased, this could be one of the root causes.

# Publisher

...
This message answers all three questions: what is happening, why it matters, and what the responder should investigate.
Burn-Rate Alerts: Why We Chose Not to Use Them
Burn-rate alerts are a core part of SRE practice. They detect fast consumption of the error budget by comparing short-window and long-window burn rates. A typical configuration looks like:
- short window: 5 minutes
- long window: 1 hour
- alert when both windows exceed the allowed burn rate
This strategy works exceptionally well for services where “bad time” occurs in small, scattered increments. But it completely misrepresents workloads with continuous, predictable blocks of bad time, such as our purge job.
During the purge, the system spends up to three continuous hours above the SLI boundary. This creates two problems for burn-rate alerting:
- Short-window burn rate is always violated.
Any continuous 3-hour “bad period” inevitably burns far more budget than the 5-minute window is allowed to tolerate. 2. The alert fires even when everything is functioning normally.
The purge job is intentionally allowed to consume most of the weekly budget.
A burn-rate alert would fire every single time: precisely the problem we were trying to solve.
Burn-rate alerts are optimised for sudden degradation. Our purge workload is neither sudden nor anomalous. It is expected, predictable, and already accounted for in the SLO.
Using only an error-budget alert gives us the behaviour we want:
- no alerts during the expected purge cycle,
- alarms only when something pushes the system beyond the weekly envelope,
- no false positives.
For this particular SLO, burn-rate alerting is the wrong tool, and recognising when not to use a pattern is as important as knowing when to apply it.
Conclusion
This entire effort started with a noisy alert that told us nothing useful. It ended with an SLO that reflects how our system actually behaves and an alert that fires only when reliability is truly at risk.
Along the way, one lesson became very clear:
With raw thresholds, numbers can be bent to say almost anything.
A threshold can be raised, lowered, or stretched until it stops firing, but none of that makes the system healthier or the signal more meaningful. Threshold tuning is not observability; it is just rearranging noise.
SLOs force a different mindset. They anchor the discussion in reliability outcomes rather than arbitrary values. They help distinguish between expected behaviour and real degradation. And they turn a metric that once created confusion into a signal we can trust.
This is not a one-time fix.
Good SLOs evolve. They are refined as workloads change, as our understanding improves, and as new patterns emerge. The work does not end when the alert turns green — it continues as a cycle of learning, tuning, and improving how we measure what matters.
The important part is that we now have a mechanism that aligns with reality, protects our users, and strengthens our operational clarity.
And for the first time in months, the monitor stopped crying wolf.