Detecting Blocking Tasks in Asyncio by Measuring Event Loop Latency

Asyncio only works if every coroutine cooperates. One blocking call can freeze your entire app. This post shows a simple watchdog coroutine that measures event loop latency, detects blocking tasks early, and turns invisible stalls into actionable metrics.
Asyncio gives you lightweight concurrency, but only as long as every coroutine cooperates. One blocking call (just one) can freeze the entire application. When that happens, all your “concurrent” tasks stall at the same time: HTTP handlers slow down, background jobs drift, timeouts trigger late, and nothing looks obviously wrong.
There’s an easy way to catch this: run a tiny coroutine that repeatedly sleeps and checks how late it wakes up. If the event loop is stuck, this coroutine wakes up late, and that delay becomes your signal. Add metrics and a graph, and you have a reliable early-warning system for any blocking task in your async code.
This post walks through why blocking the event loop is so disruptive, how to measure it, and how to turn that measurement into something actionable in production.
Asyncio in practice: cooperative multitasking
Under the hood, asyncio is cooperative. The event loop runs a set of tasks, and each task must explicitly yield control with await. When it does, the loop schedules other tasks or handles I/O events:
while True:
    task = pick_next_ready_task()
    task.run_until_next_await()
Because everything shares a single event loop thread, concurrency works only if tasks frequently yield. If they don’t, nothing else progresses.
This is the catch: a coroutine that performs blocking I/O or heavy CPU work without await prevents the loop from serving other coroutines. The entire application stalls, often in ways that are difficult to identify solely from logs.
What blocking looks like in reality
Blocking usually comes from:
time.sleep()inside async code- synchronous HTTP or database clients
- CPU-heavy work (compression, JSON parsing, regex)
- filesystem operations done synchronously
Timeline example:
t = 0 ms     everything healthy
t = 10 ms    coroutine calls time.sleep(0.5)
t = 10–510 ms event loop frozen
t = 510 ms   loop resumes, all tasks run late
Every time-based operation slips. A task meant to run every 20 ms might fire 500 ms late. An HTTP request that usually takes 5 ms now takes 505 ms.
Unless you’re monitoring the event loop itself, this is almost invisible.
A simple trick: measure loop latency with a watchdog coroutine
The idea:
- Record the current time.
await asyncio.sleep(dt)- Measure how late the coroutine wakes up.
If the event loop is healthy, the delay is small. If something blocks the loop, you detect it immediately.
latency = actual_wakeup - expected_wakeup
Implementing a loop latency watchdog
import asyncio
import logging

log = logging.getLogger(__name__)

async def loop_latency_watchdog(
    interval: float = 0.02,       # 20ms sampling
    warn_threshold: float = 0.1,  # warn above 100ms
):
    loop = asyncio.get_running_loop()

    while True:
        started_at = loop.time()
        await asyncio.sleep(interval)
        ended_at = loop.time()

        latency = max(0.0, ended_at - started_at)

        if latency > warn_threshold:
            log.warning(
                "Event loop latency high: %.3f s (interval=%.3f s)",
                latency,
                interval,
            )
Start it at application boot:
async def main():
    asyncio.create_task(loop_latency_watchdog())
    await start_your_app()

asyncio.run(main())
Seeing a spike: a blocking example
import asyncio
import time
import logging

logging.basicConfig(level=logging.INFO)
log = logging.getLogger(__name__)

async def blocking_task():
    while True:
        await asyncio.sleep(1)
        log.info("Blocking the loop for 500ms…")
        time.sleep(0.5)
        log.info("Back from blocking sleep")

async def main():
    asyncio.create_task(loop_latency_watchdog())
    asyncio.create_task(blocking_task())
    await asyncio.Event().wait()

asyncio.run(main())
Example log:
INFO Blocking the loop for 500ms…
WARNING Event loop latency high: 0.502 s
INFO Back from blocking sleep
A perfect demonstration of loop freeze → watchdog spike.
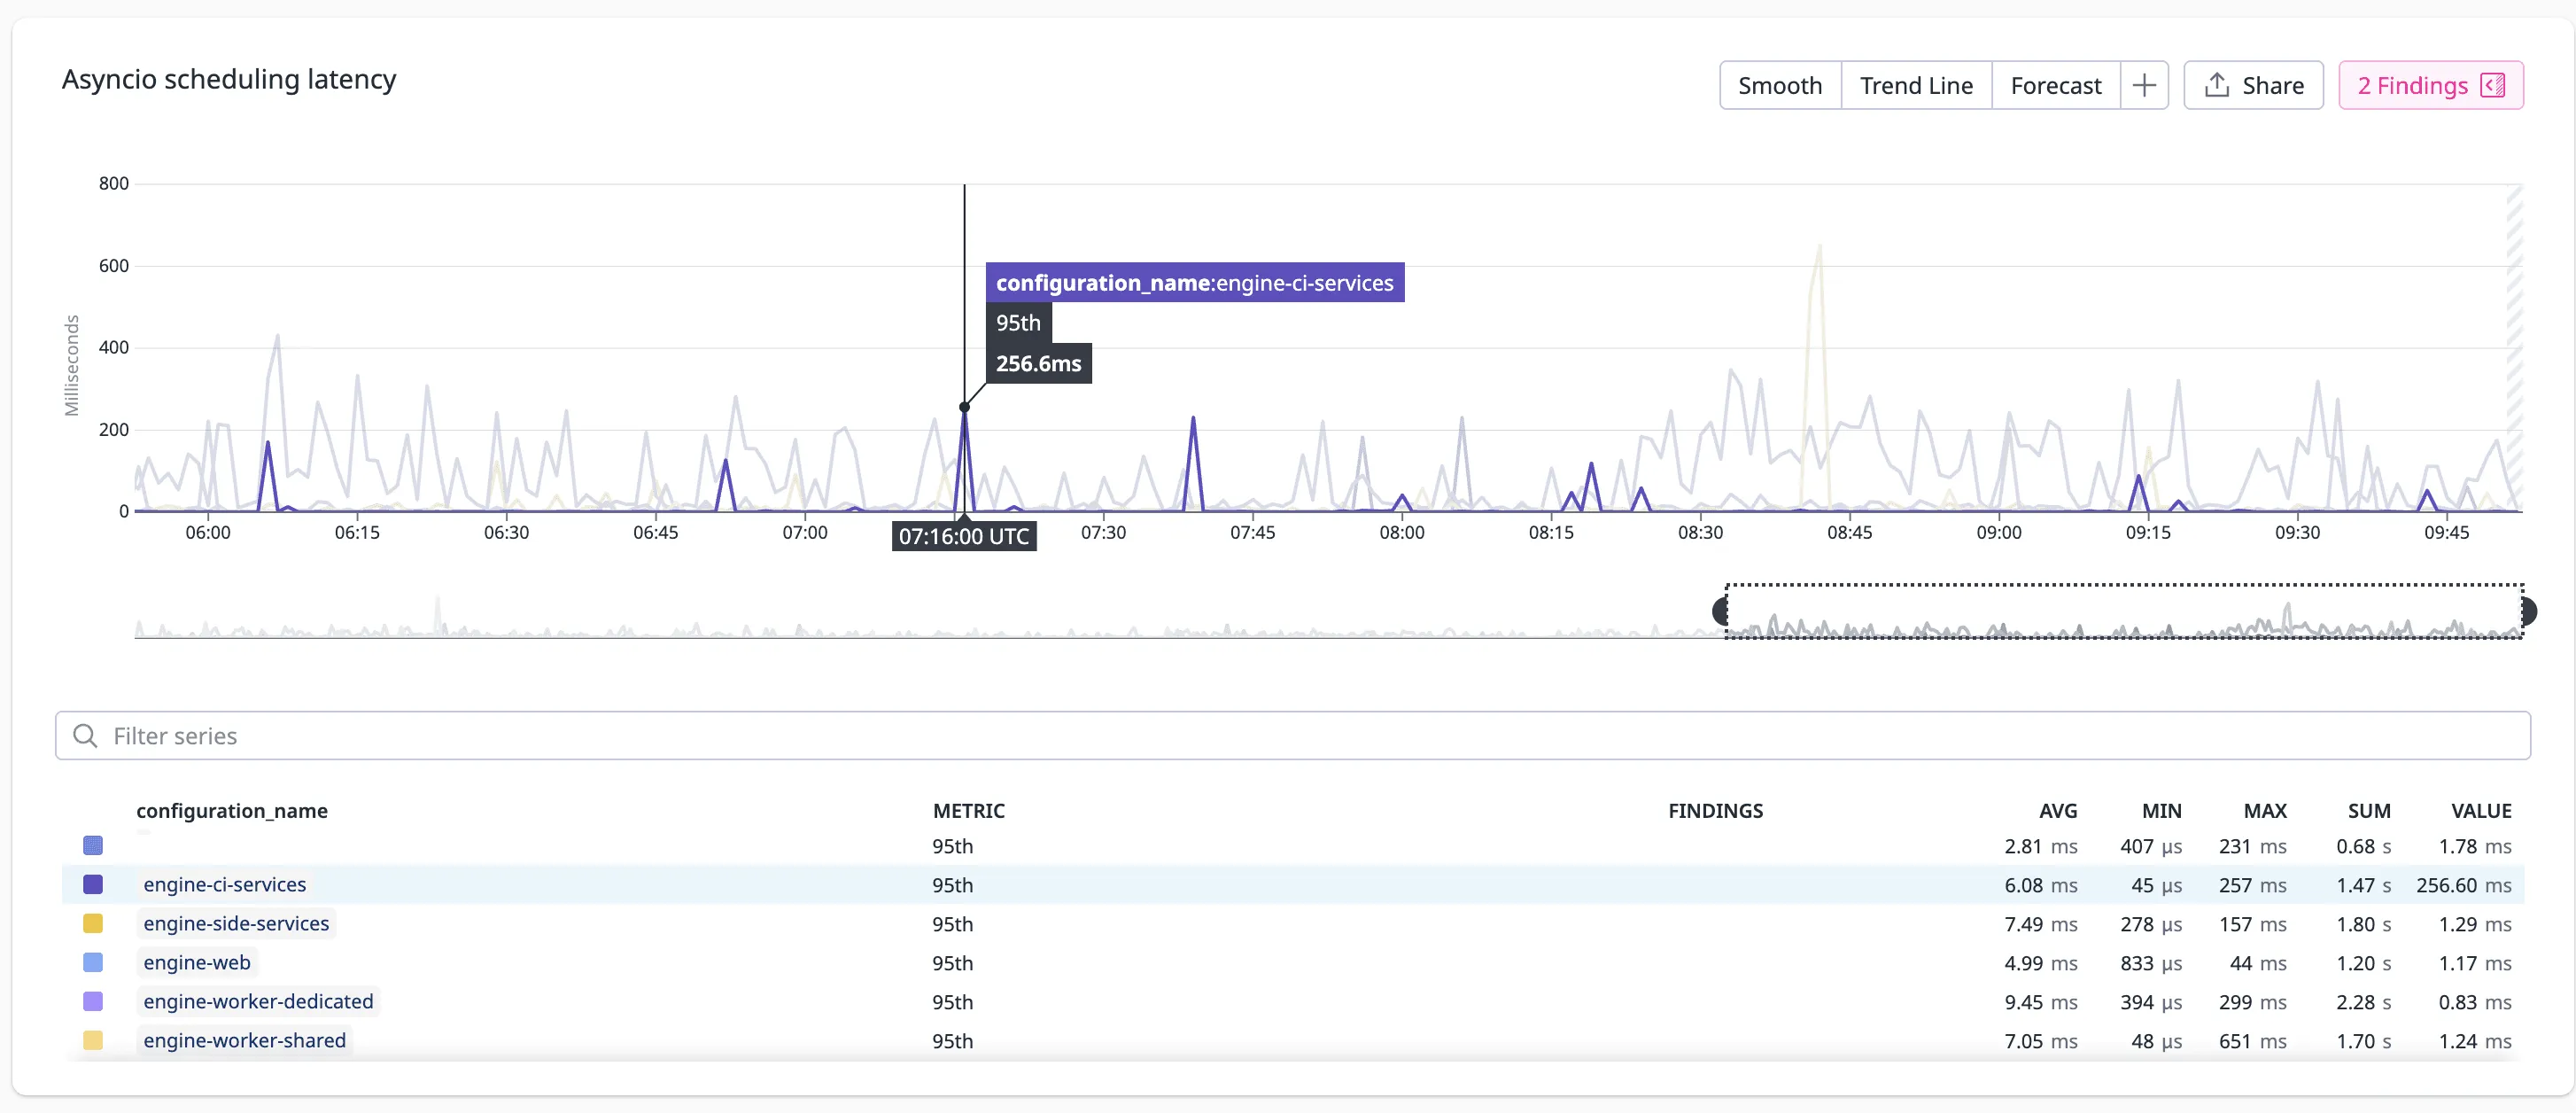
Graphing and alerting
Once you export latency to metrics, you can graph:
- p50/p95/p99 loop latency
- correlation with HTTP latency
- per-endpoint patterns during stalls
Useful alerts:
- loop latency > 100ms for 30 seconds
- p99 latency above 200ms
This gives you a clean separation between “system is slow” and “event loop is frozen.”
Tuning the sampling interval
Shorter intervals catch smaller stalls but generate more metrics.
- 5–10 ms: low-latency apps, high resolution.
- 20–50 ms: good default.
- 100 ms+: lowest overhead, detects only large stalls.
A solid starting point:
interval = 0.02 s   # 20ms
warn_threshold = 0.1 s
After detection: finding the culprit
The watchdog tells you when the loop was blocked. To figure out why, you need to correlate with:
- request logs
- CPU spikes
- GC activity
- stack dumps
- profiling
Typical fixes:
- move CPU-heavy operations to
run_in_executor - switch synchronous clients to async versions
- isolate expensive tasks into worker services
Takeaways
- Asyncio gives concurrency only if tasks cooperate.
- A single blocking call can freeze the entire application.
- A tiny watchdog coroutine reliably detects loop stalls.
- With metrics and alerts, you catch blocking tasks the moment they happen.
This type of lightweight guardrail provides immediate feedback and helps surface bugs that would be nearly invisible otherwise.