Your CI is a black box.
Open it.
How many hours did your team waste on flaky CI jobs this week? CI Insights tells you exactly which jobs are unreliable, retries them automatically, and gives you the data to fix root causes. Teams cut CI debugging time by 60%.
Used by platform teams at
From fast-moving startups to well-known enterprises
Before CI Insights
After CI Insights
Stop guessing why CI is red.
See exactly what broke and why.
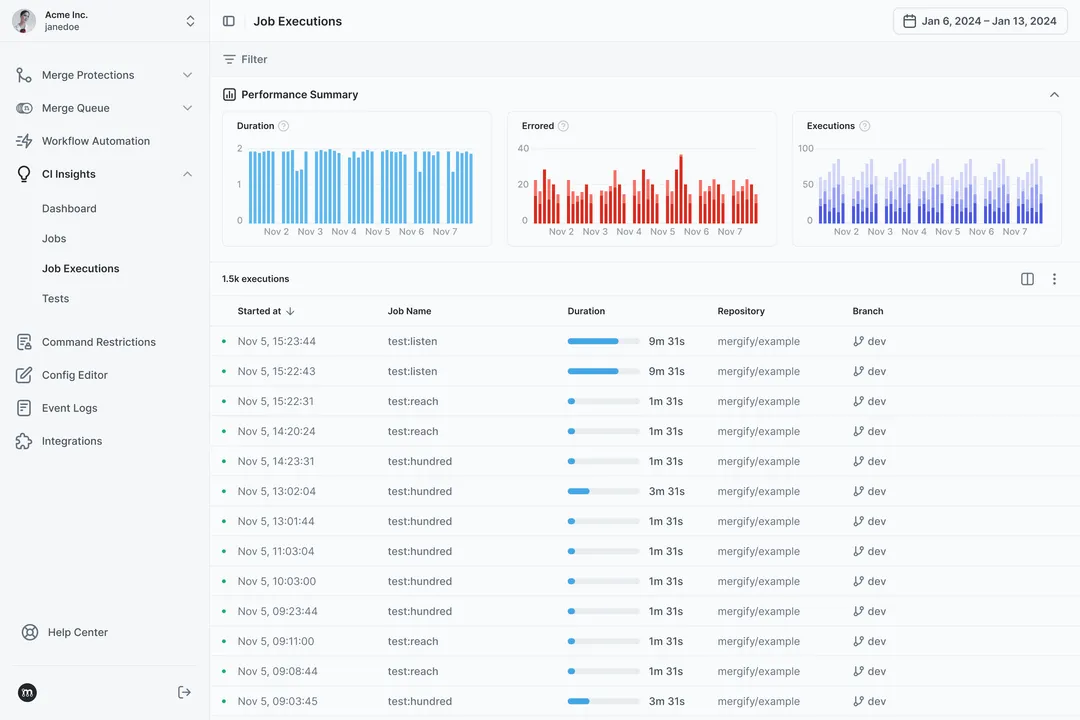
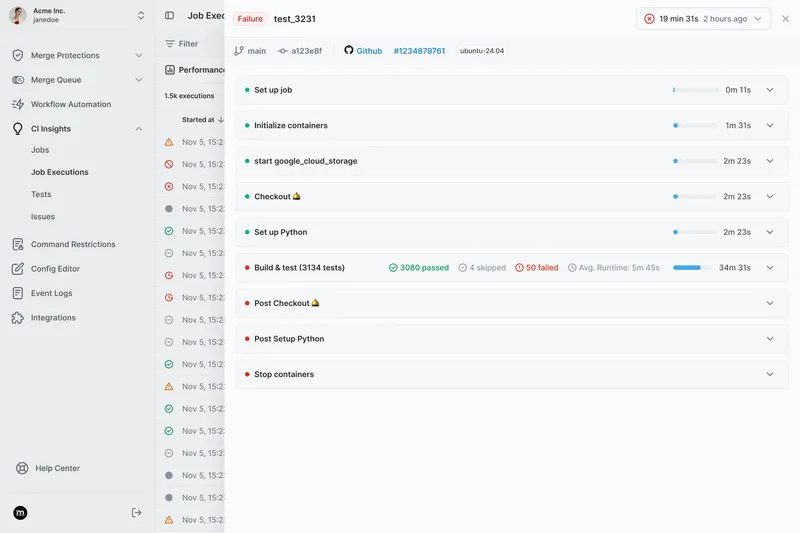
From high level CI performance, to detailed job execution insights
See overall performance and understand the root cause of job failures and slowdowns.
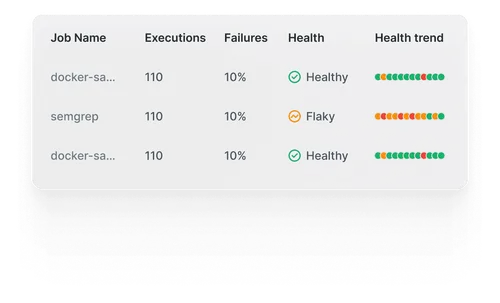
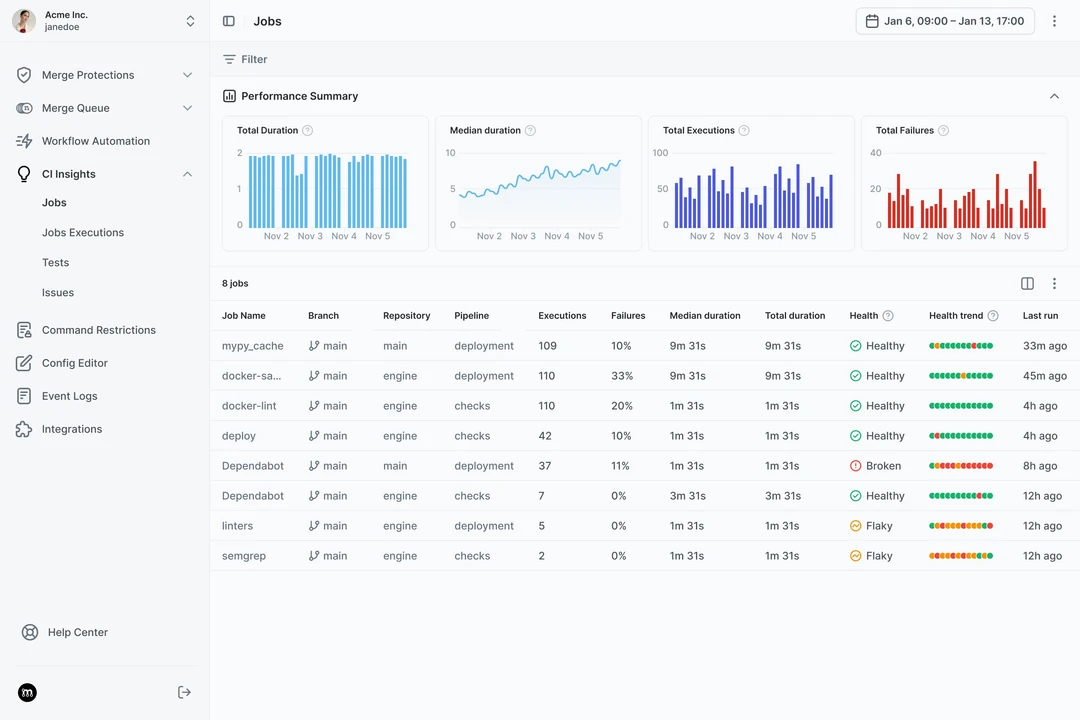
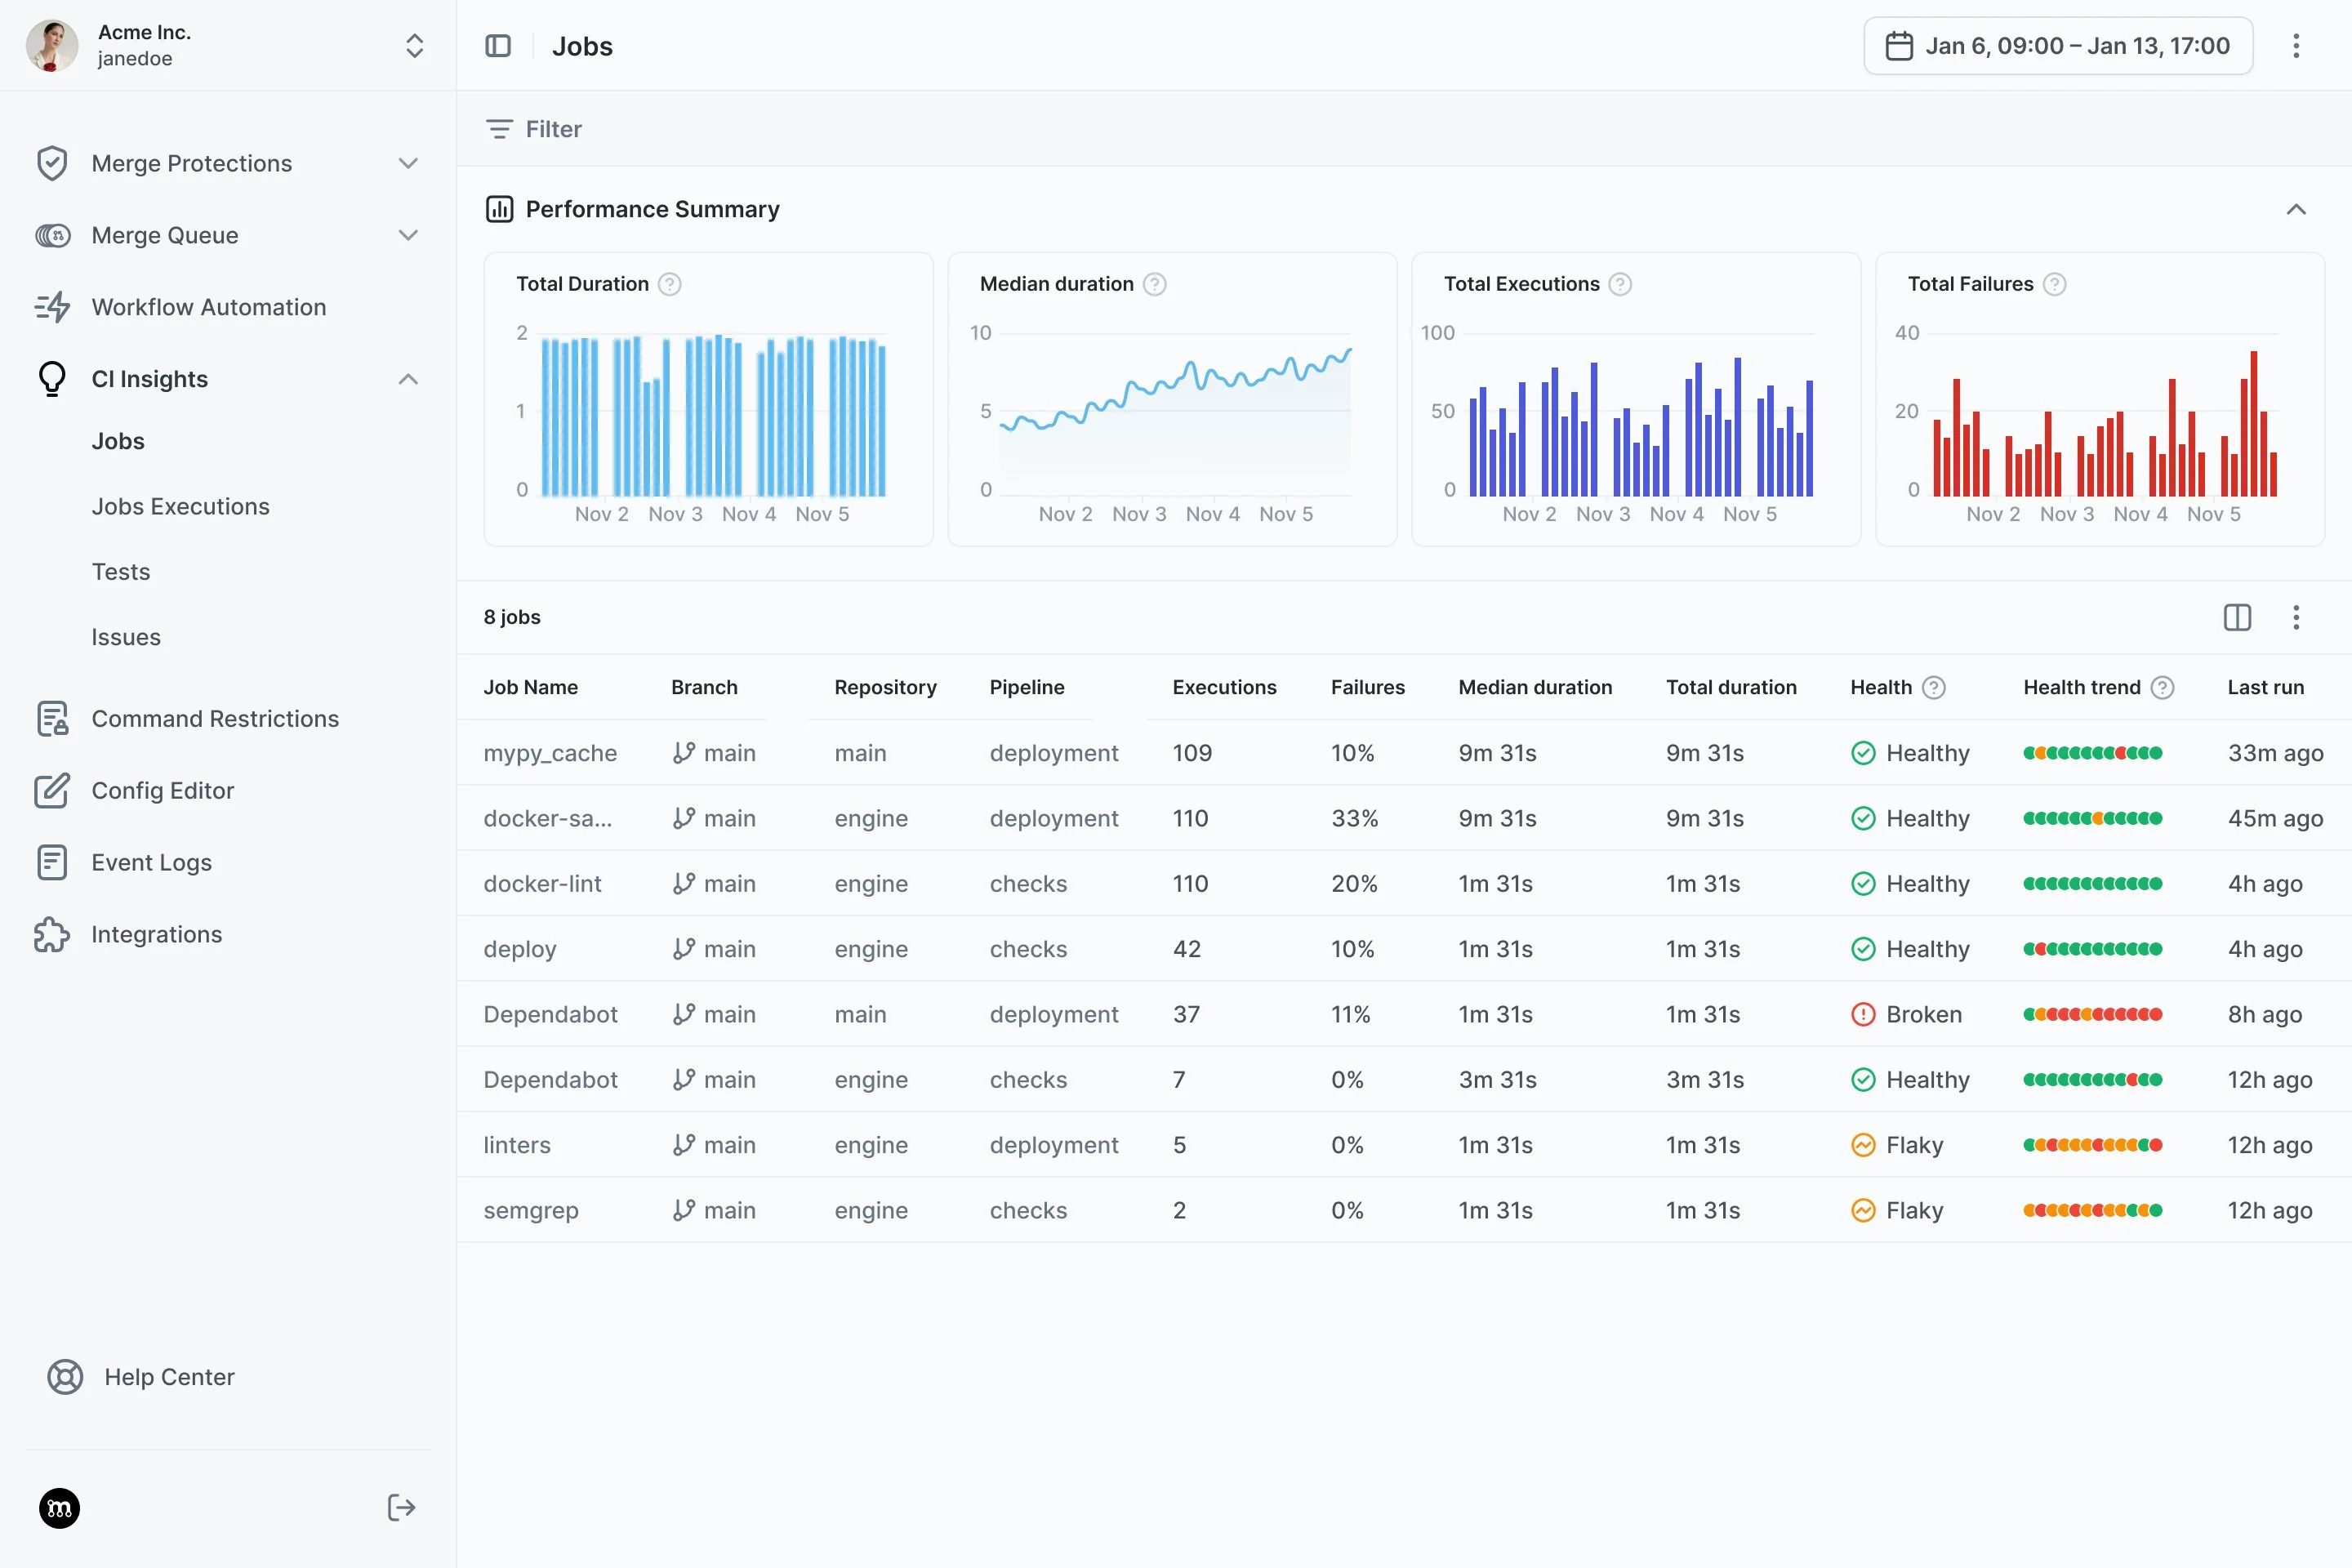
Understand Job health
See overall performance of your jobs. From the number of executions, durations, and failure rates, to the overall health score and flakiness of job runs.
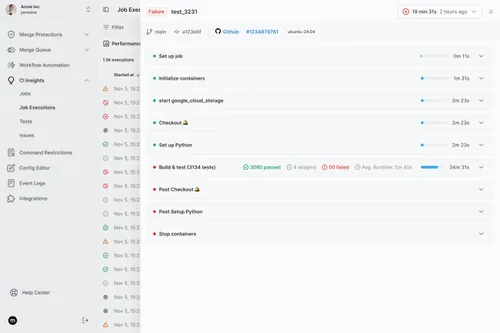
Spot slowdowns and regressions
Track job durations over time and catch regressions before they compound. Know when a job starts taking longer and why.
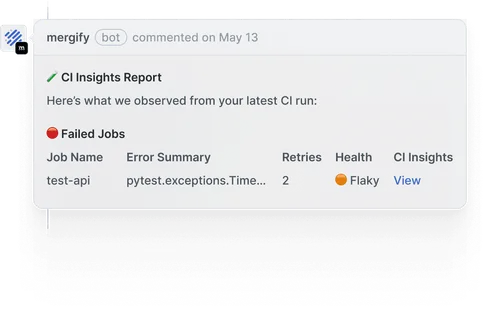
PR Summary Reports
Get immediate summary reports of any CI issues posted as comments on your PRs in GitHub.

Get notified about issues in real-time
Using our Slack integration you'll be able to get notified about any desired job outcome across particular repositories, branches, and jobs.
Before CI Insights, we were wasting hours debugging CI issues. We now cut triage time in half within a week.
Liam Hartman
Platform Engineer at Vertex
Want to see what CI Insights finds in your pipelines?
5-minute setup. Works with GitHub Actions, Jenkins, Buildkite, and soon CircleCI.
Auto-retry flaky jobs.
Track every CI issue.
Retry jobs without lifting a finger and make sure you easily keep track of every CI issue you encounter.
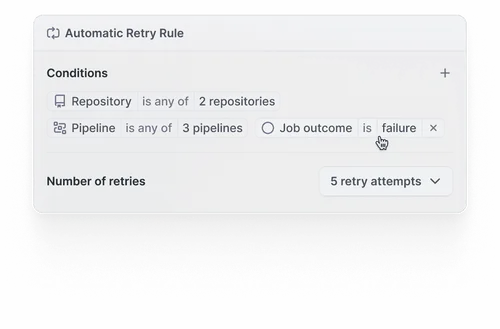
Automatic job retries
Automatically re-run CI jobs without restarting your entire pipeline. Use fine-grained filters to target specific jobs. Save time, reduce CI noise, and keep your builds flowing.
CI Issue Tracking
Running into a CI issue? Mark it and track your CI issues directly in Mergify to solve it with your team and sync it with your favorite Issue Tracking tool.
Tracking down flaky jobs and failures took hours. Our mean time to resolution dropped by 60% when we started using CI Insights.
Liam Hartman
Platform Engineer at Vertex


One dashboard. Every CI provider.
GitHub Actions for half your repos, Jenkins for the rest, CircleCI for that one team that refuses to migrate. CI Insights pulls job health from all of them into a single view. Flaky detection and auto-retry work the same way no matter which CI ran the job.
CI problems that get worse the longer you ignore them
Most teams don't realize how much CI costs them until they measure it.
No visibility into CI cost
Leadership can't explain where CI time and compute go. Costs rise but nobody can point to why.
Engineers waste hours on reruns
15 manual re-runs per week per engineer is normal. Most of those are flaky jobs that could be retried automatically.
Flaky jobs erode trust
When CI results are unreliable, engineers stop paying attention. Reviews slow down, broken code slips through.
CI health degrades silently
Without tracking, you can't tell if CI is getting worse over time. By the time it's obvious, the backlog of broken jobs is massive.
Real teams, real results
Engineering teams we helped merge faster, safer, and cheaper
Slash your CI debugging time with CI Insights
Calculate what flaky tests cost your team each month, with a breakdown you can share with leadership.
