What GitHub Webhook Latency Actually Looks Like

We instrumented GitHub webhook delivery latency for ourselves. The p95 stays under 60 seconds in steady state but climbs close to 40 minutes during check-run incidents.
GitHub doesn’t include a “webhook delivered at” header in its payloads. We built one for ourselves and watched the numbers come in uglier than the docs suggest.
”Mergify is broken”
We get a steady stream of support tickets that all sound the same: Mergify didn’t see this check-run, or Mergify didn’t see this approval. Five or ten minutes later the ticket goes stale because everything works again.
Our customers expect Mergify to react in under 30 seconds when they interact with a PR. The trouble is we don’t own the whole chain. A user clicks Approve in GitHub, GitHub fires a webhook, the webhook lands on our /event endpoint, and we process it. We only own the last step.
GitHub’s own documentation is not much help when a customer asks why:
Webhooks allow near real-time updates, since webhooks are triggered when an event happens.
Webhook deliveries can take a few minutes to be delivered and to appear in the recent deliveries log.
If your account experiences a surge in webhook deliveries, GitHub may temporarily throttle the rate of deliveries to your account.
“Near real-time” and “a few minutes” cover an enormous range. We needed numbers.
Building the sender clock we don’t have
The plan was straightforward. Every webhook payload includes one or more timestamps that record when the underlying GitHub state changed. We compare that timestamp to now() at the moment our server parses the request. The difference is our delivery latency.
We emit two metrics:
engine.github.webhook.delivery_latency         # histogram, seconds
engine.github.webhook.delivery_latency.skipped # counter
The histogram is tagged by event_type, action, and owner_id. The skipped counter has a reason tag with values like no_mapping, null_timestamp, parse_error, clock_skew. If we couldn’t compute a valid latency, we want to know why.
Nine event types cover Mergify’s hot path: the PR, review, check-run, workflow, status, and push family. They drive the react-fast-or-look-broken contract our customers care about. Anything else gets ignored.
The right timestamp depends on the action
You’d think comparing one payload timestamp to now() is a one-liner. It is not. The right timestamp depends on the event type and the action together. Each (event_type, action) pair maps to a specific field via a two-tier dispatch table:
| Event type | Action | Timestamp field |
|---|---|---|
pull_request | opened | pull_request.created_at |
pull_request | synchronize | pull_request.updated_at |
check_run | completed | check_run.completed_at |
workflow_job | in_progress | workflow_job.started_at |
pull_request_review_comment | created | pull_request.updated_at |
Most of these mappings look obvious from the payload schema. A few we got wrong on the first pass and only caught by watching the graphs.
Where the heuristic was wrong
Our iteration loop was simple: stare at the latency graphs, spot the buckets that looked weird, pull payloads for the outliers, check whether our timestamp choice actually matched what we thought it meant. Move on.
Three event/action pairs needed correcting.
pull_request_review_comment.created
First mapped to comment.created_at. We saw a roughly one-hour false latency on this bucket. The reason: when a user starts a review and writes a comment but doesn’t submit the review yet, GitHub stamps created_at with the moment the comment was drafted. No webhook fires at that point. The webhook only fires when the user clicks Submit, sometimes an hour later. We switched to pull_request.updated_at from the same payload, which moves with the actual submission.
Caveat: pull_request.updated_at also moves on labels, assignees, and milestone changes, so this can occasionally under-report. In our data the bias is small enough to ignore.
workflow_run.in_progress
First mapped to run_started_at. We saw the metric inflate on backed-up runner pools and assumed run_started_at was carrying queue time, so we switched to updated_at, which pulled the numbers back into a sane range. Writing this post made us look at the schema again: run_started_at is execution start, and created_at is when the run was queued. Our heuristic was right that we were measuring something queue-related, just for the wrong reason. The proper fix is created_at if you want queue-inclusive delivery latency, or run_started_at if you want to exclude queue time on purpose. We’ve updated our code accordingly.
check_run.rerequested
No accurate timestamp anywhere in the payload. We dropped the mapping entirely. The metric is honest about what it can’t measure, and a missing data point is better than a misleading one.
What the numbers actually say
Once the heuristic settled, we could finally look at GitHub.
In steady state, the overall p95 sits under 60 seconds. We have an SLO target at 60 seconds for p95 and 40 seconds for p50, and on a normal day we live well inside it:
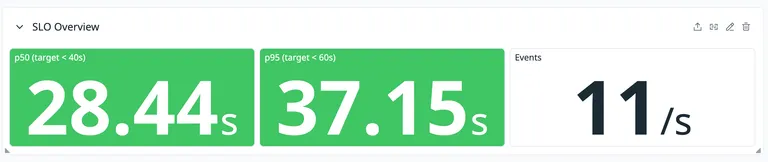
That’s in the ballpark of “near real-time” but not what most engineers picture when they hear the phrase. During bad incidents the picture changes. The chart below shows two weeks of p95 broken down by event type. Most events stay in single-digit seconds the whole time. Then on a Monday afternoon a check-run incident pushes the bucket close to 40 minutes for stretches:
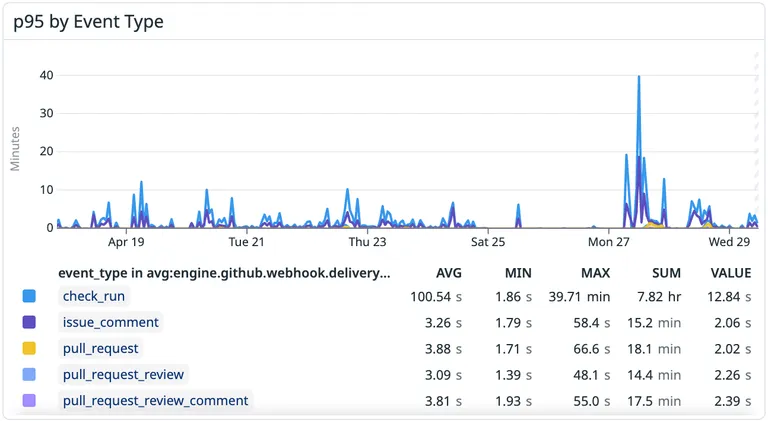
Monday April 27 is one of the days GitHub later named publicly in an availability update. They flagged a search outage that day, not webhooks specifically, but the timing tells you their infrastructure had a bad afternoon.
We have also seen pull_request.opened and pull_request.synchronize sit at 5-minute p95 for hours during other incidents. Those numbers are not p100 outliers; they describe the bulk of the distribution while the incident lasts.
Most check-runs that arrive late come from third-party CI like Jenkins or Buildkite. GitHub Actions almost never shows up in our late buckets. The latency we were attributing to GitHub was often a Jenkins job sitting in a queue and posting its check-run status fifteen minutes later. We added a check_run_source tag (github vs external) so we could stop blaming GitHub for Jenkins.
Same idea for workflow_job: we tag runner as github_hosted or self_hosted based on whether the labels list contains the self-hosted string. Self-hosted runners with shallow pools queue jobs longer; the latency profile is wildly different from GitHub-hosted runners and worth splitting in dashboards.
Things to be honest about
Our metric is end-to-end from “GitHub stamped the timestamp” to “we called now() after parsing the payload.” That second part includes our own server processing time. Strictly speaking, this is stamp-to-ingest latency, not pure network delivery: a slowdown on our side shows up here as “GitHub got slower.” We accept the conflation because our parse path is small and instrumented separately, but it’s worth being explicit about what the metric actually is.
sequenceDiagram
    participant G as GitHub
    participant M as Mergify
    G->>G: Records state change (T1)
    Note over G: Opaque queue and send
    G->>M: POST /event
    M->>M: Parse payload, now() = T2
    Note over G,M: delivery_latency = T2 - T1
The other end of the measurement has its own gap. The timestamp we read from the payload is when GitHub recorded the state change, which is usually close to when GitHub queues the webhook, but the corrections above show how badly that can drift. Any new event type we add gets the same outlier-watching pass before we trust the bucket.
Clock skew is real. Sometimes the payload timestamp lands slightly ahead of our now(), producing a negative delta. We clamp negatives in the range [-5s, 0) to zero. Anything beyond that gets logged and dropped via the clock_skew skip reason. The 5-second threshold is empirical, picked from the distribution of negatives we actually saw.
We wrap the whole tagging path in try/except. A bug in metric extraction must never break webhook reception, since webhooks are our only input, and missing a metric beats dropping a real event.
Cardinality and rollout
Tagging a histogram by owner_id is high cardinality. We have hundreds of customer orgs, so we rolled the metric out in two phases.
First, we tagged everyone with the per-owner breakdown to validate that the system worked and our heuristics weren’t lying — aggregate metrics aren’t enough at this stage, you need per-customer detail to spot the outlier orgs whose payloads break your assumptions. Once we trusted the data, we narrowed the per-owner tag to a bounded allowlist of orgs gated by HTTP_MONITORING_FOR_ORG, the same flag we already use for HTTP request monitoring. Everyone else still feeds the aggregate metrics.
What we wish GitHub did
If GitHub published the timestamp at which they sent the webhook, this entire post would be three lines long. They don’t.
There is a deliveries REST endpoint that lists every webhook GitHub fired for your account. It has no filters that matter. You browse from now backward with a cursor: you can’t query deliveries that took longer than X seconds, and you can’t filter by status or event type beyond the most recent few entries. It’s an event log with a cursor, and we’ve never been able to use it for anything operational.
Sender-side metrics from GitHub would also help. Today we have no idea what their internal queue depth looks like or what their delivery error rate is for our account. We have a single throttled_at timestamp on individual deliveries, and not much else. Half the chain we depend on for an SLO is opaque.
GitHub’s availability update this week mentions moving webhooks to a different backend, out of MySQL. That should help with raw throughput. What it doesn’t address is the observability gap: even if delivery gets faster, we still won’t know what their internal queue depth looks like for our account, or whether a slow window is throttling, retries, or backend lag. Sender-side metrics are the part we keep wishing for.
If you depend on webhook timing
If you build something on top of GitHub webhooks and your product depends on timing, measure the latency yourself. GitHub will not do it for you.
The right timestamp to compare against depends on the (event_type, action) pair, not just the event type, and you will get it wrong on the first try. Watching graphs and chasing outliers beats designing the dispatch table on paper.
We spent more time on this dispatch table than any of us would like to admit. The graph is finally boring, which is the only thing we ever wanted. If GitHub ever ships a delivered_at header, the first round is on us.
Next time someone tells you webhooks are real-time, ask for the p95.