 Alexandre Gaubert
Making Dashboard Charts Actually Useful: Brush Zoom, Click-to-Filter, and Shareable URLs with ECharts

How we wired ECharts brush zoom, click-to-filter, and URL-shareable state into a 10-chart dashboard, plus the dataZoom approach and ghost-dot bug we hit on the way.
Most dashboard charts are pictures. You look at them, maybe hover for a tooltip, and that’s it. Over the past few weeks we turned ours into tools you can actually explore, with every view a URL you can paste in Slack.
The problem
We run a merge queue product that processes thousands of PRs daily. Our stats dashboard has about ten charts: CI run times, queue throughput, check outcomes, batch bisection counts. They all had the same limitation: you could pick a date range from a dropdown, and you could look at the chart. That was it.
When a user spotted something weird (a spike in CI failures on Tuesday, a specific queue behaving differently), they had no way to drill in. They would screenshot the chart, paste it in Slack, and say “look at this area.” The recipient would open the same page, try to remember which date range and filters to apply, and often give up.
We needed three things: brush zoom to drill into time ranges visually, click-to-filter so clicking a series applies that dimension as a filter, and URL state persistence so every view is a shareable link.
Brush zoom: selecting a time range by dragging
The most natural way to zoom into a time series is to drag across it. ECharts has a brush component for this, but wiring it up across a page with ten synchronized charts took some care.
The challenge: brush zoom needs to update the actual date range, not just the chart’s viewport. When you brush-select March 3 to 5 on one chart, all ten charts should re-fetch data for that range, the date picker should update, and the URL should reflect the new range.
We built this around a StatsChartsSyncProvider context that wraps all charts on a page. When a brush selection fires, it calls setCustomRangeWithTimeLock, a function from our shared useDateRangeWithTimeLock hook. That function does three things at once: sets the date range, enables time lock (so relative presets like “past 7 days” don’t override it), and pushes from, to, and time_lock=1 to the URL:
// inside the Stats page component:
const handleBrushRangeSelect = useCallback(
  (start: Date, end: Date) => {
    setCustomRangeWithTimeLock(start, end);
    onRangeChange({ startDate: start, endDate: end, key: "selection" });
  },
  [onRangeChange, setCustomRangeWithTimeLock],
);

return (
  <StatsChartsSyncProvider onBrushRangeSelect={handleBrushRangeSelect}>
    {/* all chart widgets */}
  </StatsChartsSyncProvider>
);
Each chart component just passes enableBrushZoom as a prop. The provider handles the rest, including tooltip synchronization across charts via ECharts’ axisPointer.link, so hovering on one chart highlights the same timestamp on all others.
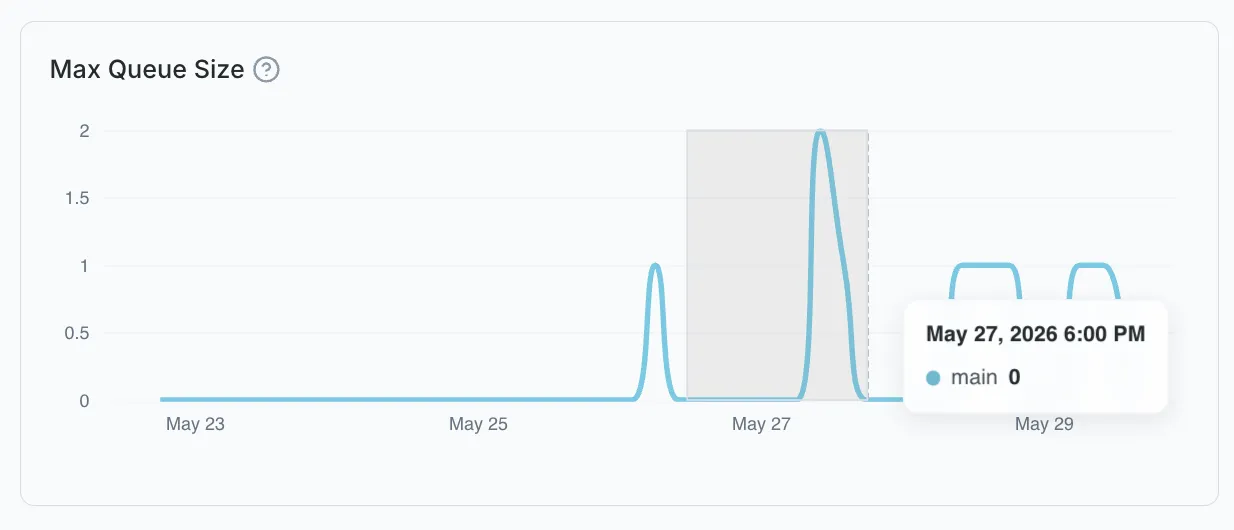
The gray rectangle in that screenshot is the live brush selection on one chart. Releasing the drag fires brushEnd, the provider calls setCustomRangeWithTimeLock, and the other nine charts on the page refetch.
Click-to-filter: turning chart segments into buttons
Bar charts broken down by queue, branch, or priority show you the distribution. But what if you could click a hotfix bar segment and immediately filter the entire page to just the hotfix queue?
The implementation needed a small state-management refactor. Our filter system was designed around an uncontrolled pattern: the useFilters hook owned the filter state internally, read defaults from URL params, and called a parent callback on change. Click-to-filter means the parent (the Stats page) needs to inject filters programmatically.
We added a controlledFilters mode to useFilters. When provided, the parent owns the filter array and the hook reflects it. In controlled mode, we preserve filter IDs through the callback chain so the parent can track identity across multi-select updates:
// inside useFilters:
const isControlled = controlledFilters !== undefined && controlledFilters !== null;
const effectiveFilters = useMemo(
  () => (isControlled ? addIdsToFilters(controlledFilters) : (filters ?? [])),
  [isControlled, controlledFilters, filters],
);
On the chart side, we added cursor: "pointer" and a small border on emphasis to signal that bar segments are clickable, while marking the invisible anchor series (used for tooltip sync) as silent: true so it doesn’t swallow clicks. The Stats page serializes the current filters to the URL’s filters query param, so clicking hotfix, copying the URL, and sending it to a colleague gives them the exact filtered view.
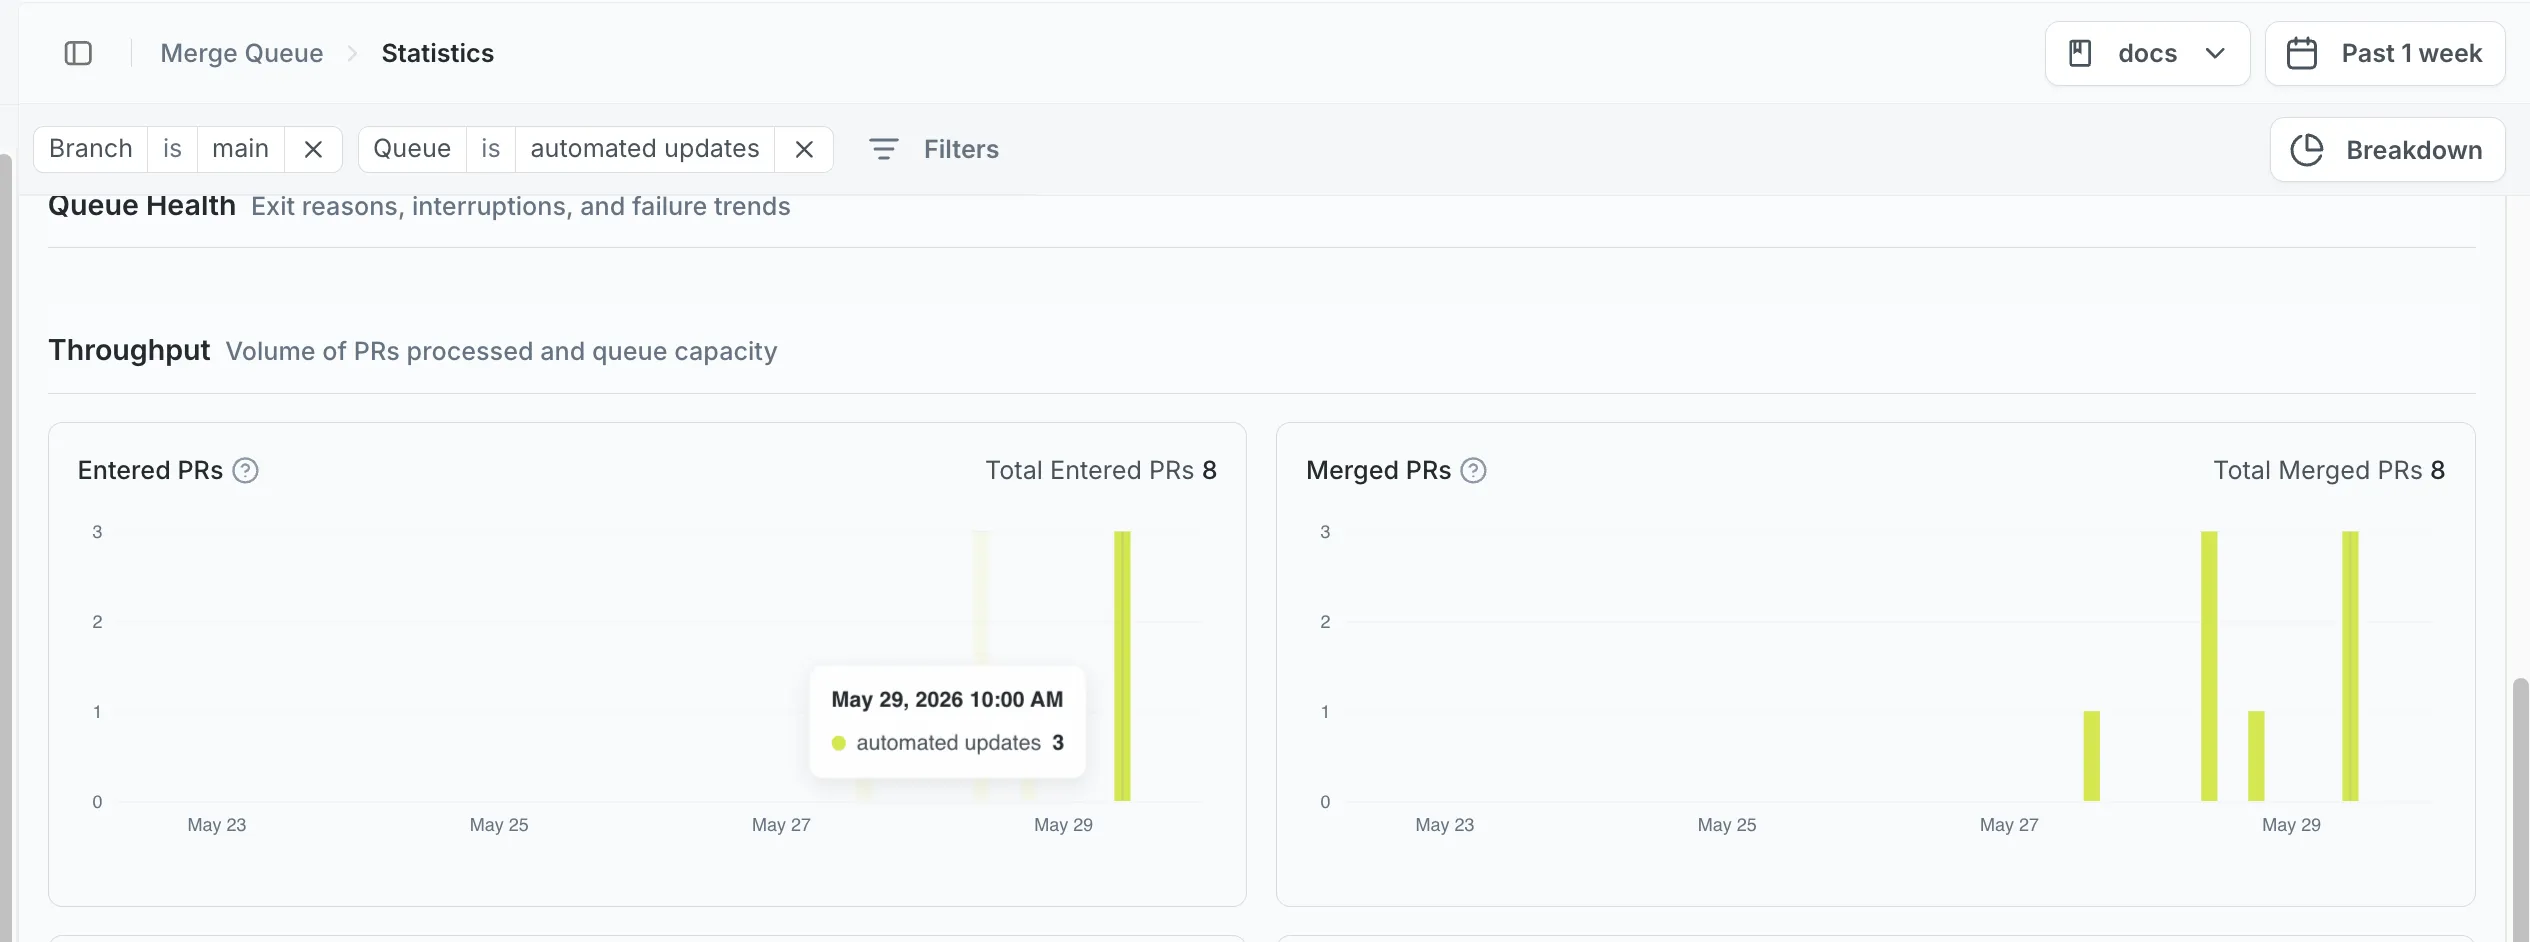
You can see the result above the charts: every active filter is a removable pill, the URL carries them, and the tooltip is the same one tracking across both charts at once.
URL state: every view is a permalink
The useDateRangeWithTimeLock hook handles the bidirectional sync between React state and URL parameters. It reads range_preset, from, to, and time_lock from the URL on mount, and pushes changes back via useNavigate from react-router-dom. “Time lock” is the design choice that matters here: when locked, the exact from/to timestamps are used; when unlocked, the preset (e.g., “Past 7 days”) is applied relative to now.
This distinction matters because without it, a shared URL with from=March 3&to=March 5 would drift. If the recipient opens it the next day, the UI recomputes “Past 7 days” and they see a different range. Time lock pins the view.
A tricky edge case was sidebar navigation. Clicking a sidebar link within the same product section (e.g., from “Queue Health” to “Throughput”) should preserve the date range, but navigating to a different product should reset it. We solved this by checking whether the destination route belongs to the same section before deciding whether to carry forward the search params.
What didn’t work
Our first brush zoom approach used ECharts’ dataZoom component, the built-in zoom with a slider bar at the bottom. You can listen to its zoom events and refetch, so it isn’t a dead end. But the slider adds permanent chrome at the bottom of every chart, which scales badly to ten charts on one page, and dragging across the slider is a worse gesture than dragging directly across the plot. brush gives us that direct gesture without the chrome, and we route the event through the same setCustomRangeWithTimeLock path so the refetch story is identical.
The ghost dot on the X-axis. Our invisible __anchor__ series (a flat line at y=0 used for tooltip synchronization) was rendering a hover dot at the bottom of charts. Setting showSymbol: false wasn’t enough; ECharts still renders a symbol on hover. You can also disable that via emphasis: { disabled: true }, but for an anchor series you never want to interact with, the cleanest fix is symbol: "none", combined with snap: true and triggerOn: "mousemove|click" on the axis pointer to eliminate flickering.
Sparse time-series data broke chart breakdowns. Our getDimensionsKeys function extracted available dimension keys (queue names like automerge, urgent, zero-risk) from the first data point only. If the first time bucket had data only for automerge, the other queues never appeared in the chart. The fix was scanning all data points to build the complete set of dimension keys. Obvious in hindsight, but it only showed up against real production data, where not every queue has activity in every bucket.
Results
Every chart on our stats page now supports brush zoom. Clicking a series segment applies a filter and updates the URL, and date ranges persist through navigation. We didn’t measure click-through rates (this isn’t that kind of product), but the Slack screenshots-with-red-circles stopped. People now just paste URLs.
The useDateRangeWithTimeLock hook is shared between our merge queue stats and CI Insights products. The controlled/uncontrolled filter pattern is reused across three different page layouts. And the brush zoom infrastructure required zero changes when we added it to test insights charts; we just wrapped existing widgets and passed enableBrushZoom.
Takeaways
If you’re building dashboards with ECharts (or any charting library), build URL state persistence first. It forces you to think about what state defines a “view” (date range, filters, breakdown mode) before you write any chart code. The rest follows naturally.
Treat chart interactions as filter mutations, not chart-level state. A brush selection is a date range change. A series click is a filter. When chart gestures write to the same state as your filter bar and date picker, everything stays in sync for free.